
Sales Reports · Analytics
Track Your Restaurant Sales with Data
See orders, revenue, average basket and channel performance in one panel. Follow daily changes and period comparisons to measure clearly which day, branch or channel performs better.
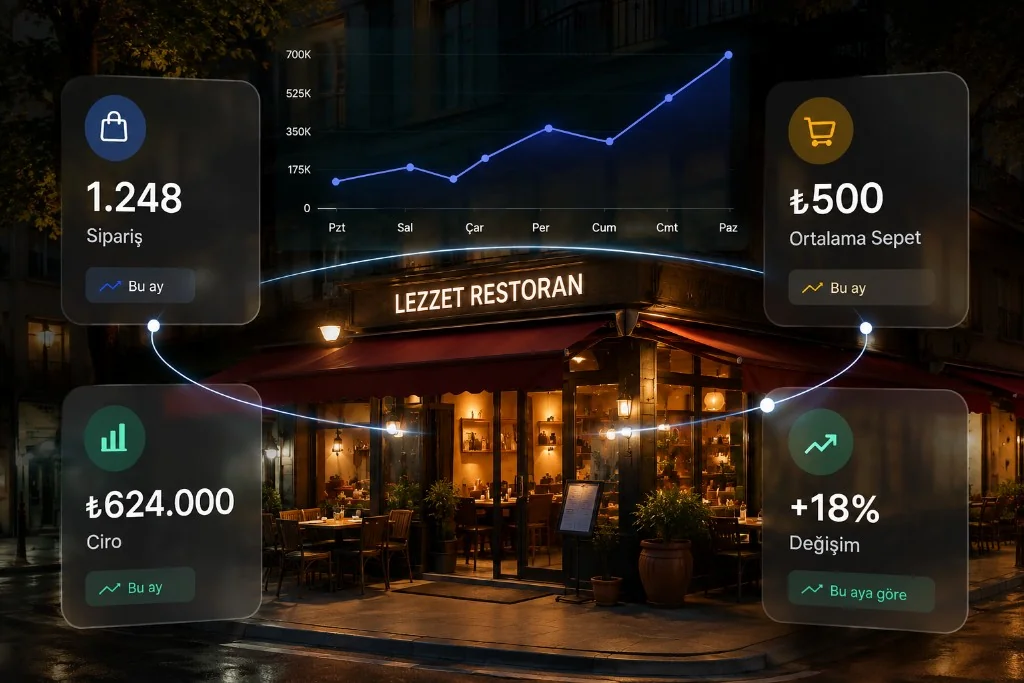
Total Orders
Order count in the selected period.
Total Revenue
Total sales amount for the same period.
Average Basket
Average spend per order.
Branch / Channel Performance
Branch and order-channel breakdowns.
Featured reports
See Your Business Performance at a Glance
Orders & Revenue
Track how many orders you received and how much revenue you generated in the selected period.
Daily Sales Trend
See on a chart which days sales rose or fell.
Average Basket
Track average spend per order and measure changes in basket value.
Period Comparison
Compare this week, this month or your chosen period with the equivalent previous period.
Trend & comparison
Which Days Are Strong, Which Period Is Better?
Daily sales trend
Which days are strong?
Period comparison
This month or last month?
How reporting works
Capture Data, Compare, Decide
-
01
Orders are recorded
Completed orders are stored in the system with date, amount, items and channel.
-
02
Data is summarised
Order and revenue data is organised daily and prepared for reporting.
-
03
Choose a period
Review any period by selecting day, week, month or a custom date range.
-
04
Compare performance
Compare results with the previous period, a branch or an order channel to see the change.
Channel performance
Which Channel Drives Your Revenue?
Review performance separately for web, QR, pickup, delivery and other order channels.
- Web%42
- QR%24
- Pickup%18
- Delivery%16
- Which channel brings more orders?
- Which channel generates higher revenue?
- How does channel performance change within a period?
- What share of total sales does your own order channel hold?
Multi-branch businesses
Watch Each Branch Separately, the Whole Business Together
View each branch’s sales performance separately in multi-branch businesses. Compare branches within the same period to spot strengths and areas to improve more easily. Compatible with franchise online ordering.
| Branch | Orders | Revenue |
|---|---|---|
| Kadıköy | 842 | ₺421K |
| Ataşehir | 716 | ₺358K |
| Beşiktaş | 641 | ₺320K |
| Maltepe | 503 | ₺251K |
Revenue ranking
- Branch-level orders
- Branch-level revenue
- Average basket comparison
- Daily and period performance
- Centralised reporting
Real-time decision support
See Not Only Revenue, but Why Sales Move
Revenue alone does not tell the full story. Track order count, average basket and channel mix together to read the change behind sales movement more accurately.
What can you see with sales data?
See Today, Measure the Change
| Metric | What it shows |
|---|---|
| Order count | Total demand |
| Revenue | Total sales |
| Average basket | Spend per order |
| Daily trend | Sales movement |
| Period delta | Growth / decline |
| Branch performance | Differences across branches |
| Channel performance | Order sources |
Use reports more meaningfully
Looking at Reports Isn’t Enough — Compare Correctly
Compare equal periods
Compare a 30-day period with another 30-day period for healthier results.
Evaluate orders and revenue together
When revenue rises, also check how order count changes.
Identify peak days
Analyse which days of the week and which hours sales increase. Support peak days with campaign management.
Compare branches
Track differences between branches regularly to spot performance shifts early.
FAQ
Frequently Asked Questions
Which sales metrics can I see?
Can I review a specific date range?
Can I compare with the previous period?
Is it suitable for multi-branch businesses?
Can I export reports?
Why do reports open quickly?
Manage Your Sales with Data
Track orders, revenue and channel performance in one panel; measure growth clearly with period comparisons.
Explore in detail: menu engineering · campaign management · kitchen display · signup & setup